Authenticx
Data-Backed Storytelling: The Strategic Data-Backed Story Set-Up
September 17, 2024 by Sally Perkins
Copied link
When we see quantitative data trends that change over time, we have the starting elements of a story (this is data storytelling). When things change, we inevitably ask, “Why? What happened?”
Stories compel our brains because something happens. The characters are moving along when suddenly something changes, usually for the worse. So, data trends are the start of a story. But stories don’t typically start with the “big happening,” or the “Uh Oh.” Rather, they start with relative “Normal” before the “Uh Oh” occurs.
So too, data-backed stories need to start with a sense of normal to set the audience up to receive the “Uh Oh” — the change we see in the data. The “Uh Oh” is most compelling when something painful occurs that the audience must feel for a period of time in order to want change.
Read these three Data-Backed Storytelling Tips to learn more about how to set up the “Normal” with your quantitative trends and how to help the audience feel the pain of the “Uh Oh.”
Think of quantitative data trends as stories.
“All I see are charts and graphs. Where’s the story in that?”
When you’re overwhelmed with multiple sources of data, charts, graphs, and tables, one simple place to start is to look for trends over time. After all, stories start at one point in time, then they move us through a sequence of events to another point in time.
What’s important to remember, however, is that a chronology is not a story. For example, we could say:
- In Q1 of 2023, we had a 76% customer retention rate and a 48% satisfaction rate.
- In Q2 customer retention was at 59% and satisfaction at 48%.
- In Q3 customer retention was at 70% and satisfaction at 53%.
- In Q4 customer retention was at 62% and satisfaction at 57%.
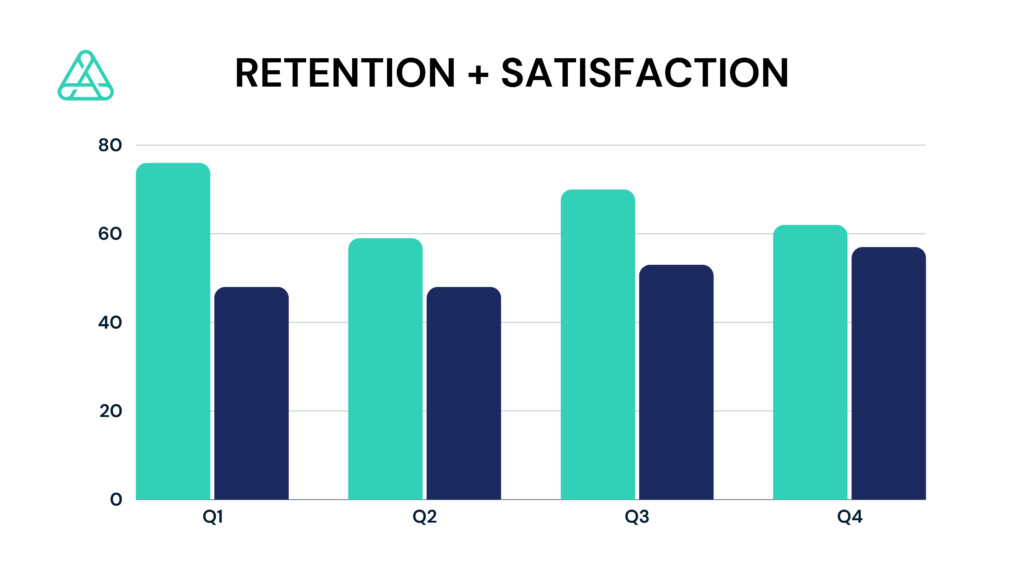
But those data don’t tell a story until two things happen. First, the “Normal” and “Uh Oh” of the story must be established (see the Story Elements). In this case, “Normal” might be the average correlation between customer retention and satisfaction scores for the past few years. Then, the “Uh Oh” must be named.
The “Uh Oh” might be a simple question that perplexes us about the data: “Why in the world, in Q4, would retention scores have gone down while satisfaction scores went up?”
Secondly, the “Uh Oh” must answer the “why” question, drawing upon more contextual and qualitative data to explain the shifts. For example, the storyteller (you!) could share micro customer stories about a seasonal change or market change that would account for the loss of customers or stories from customers in which they explain their abandonment or stories that explain what caused those who stayed with the product to be so highly satisfied.
In essence, the trending data become a story when they are explained in terms of a “Normal” and an “Uh Oh” that needs attention. The story is most compelling when the “Uh Oh” can be explained and illustrated through vivid micro customer stories!
Take this challenge: Look at some of your most relevant data. Study the trends over time. When you see signals of some shift or anomaly, you know you have the beginning of a compelling story.
Join the story on LinkedInAvoid starting your story with the problem. Instead, start with the “Normal.”
Occasionally, a good movie will submerge the characters, and by extension you, the audience, into a conflict or a crisis within the first few seconds of the film. You’re hooked, your cortisol is already up, and you have to know what comes next.
But inevitably, for the story to work, at some point you must know what the “Normal” was for the characters prior to the crisis to understand what those characters want and why.
But in contrast to audiences of Hollywood storytelling, audiences of data-backed stories usually need to be grounded in the “Normal” before getting to a crisis or problem. To jump into the crisis could raise unnecessary questions, doubt, skepticism, or fear about where this crisis is coming from and whether it’s real. Instead, audiences are typically more open-minded about the “problem” of the story if they understand where it’s coming from.
“Normal” might be established by simply stating the parameters of the data that are the basis for the story–for example the data source, the time frame, and who or what the data represent. “Normal” might offer a few data points the audience is not surprised by, like a stable trend or even a growth point worth celebrating. This establishes context and perspective that enables the audience to fully grasp the upcoming “problem” part of the story.
Think about a time when you started your story in the middle and skipped the “Normal.” What results did you get?
Share your story on LinkedInTo drive change, bring the audience into the pain.
If Dorothy landed in Oz, immediately met the Good Witch Glenda, clicked her red shoes together, and went home, we would neither care about nor remember the story. We care about Dorothy because we feel her pain of wanting to get home and the suspense of every obstacle in getting to Oz entices us to stay with the story until it’s resolved.
So too, effective data-backed storytellers don’t just name the problem, they take the audience into the pain point by sharing data to show prevalence, evolution over time, and impact. They also help the audience feel the pain by giving examples of the impact on real people.
For example, a strategically designed story might use conversational data to show what customers say they are wanting — their “object of desire.” Then the story might show quantitatively how often the customers are struggling to get what they want. That data point might be followed by qualitative micro customer stories that show the audience how it feels to the customers not to be able to get what they want.
Then, the story becomes even more potent if another layer of pain, proven quantitatively and qualitatively, is added to that. “Not only can our customers not get what they want, they’re also having to wait days to find out that they can’t get it. Ouch.”
This strategic structure leaves the audience:
- Cognitively convinced of the extent of the problem
- Emotionally sympathetic to the human experience impacted by the problem
- Needing to get to a resolution
Is there a moment when you’ve experienced taking the journey for the emotional and cognitive pull rather than “clicking your heels?”
Join the conversation on LinkedInCatch up with this blog series:
- Blog #1: The Human Brain Needs Data-Backed Stories
- Blog #2: How Data Can Inspire
- Blog #4: The Strategic Data-Backed Story Ending
About Sally Perkins
Dr. Sally Perkins serves as Sr. Manager of Storytellers at Authenticx. She analyzes quantitative and qualitative conversational data from which she crafts impactful data-backed stories that offer insights into how professionals across industries, such as healthcare, can improve the customer experience and their business outcomes.
About Authenticx
Authenticx was founded to analyze and activate customer interaction data at scale. Why? We wanted to reveal transformational opportunities in healthcare. We are on a mission to help humans understand humans. With a combined 100+ years of leadership experience in pharma, payer, and healthcare organizations, we know first-hand the challenges and opportunities that our clients face because we’ve been in your shoes. In 2023, Authenticx was ranked No. 349 on the Inc. 5000 recognized as one of America and Indiana’s fastest-growing private companies.
Want to learn more? Contact us!
Or connect with us on social! LinkedIn | Facebook | Instagram | YouTube | Twitter/X